Your traffic numbers look good. Google Analytics shows thousands of visitors reaching your product pages. They add items to cart. Then 69% of them leave without buying.
You are not alone. The average cart abandonment rate across e-commerce sits at 69.99% according to industry research on cart abandonment rates. For every 100 potential customers who add products to their cart, only 30 complete the purchase.
That means for every $100 in potential revenue, $70 walks away. If your site generates $500,000 in annual revenue, you are leaving approximately $1.16 million on the table through checkout abandonment alone.
This is not a traffic problem. It is not a product problem. It is a checkout problem.
The gap between adding to cart and completing purchase represents the single largest revenue leak in e-commerce. Small businesses lose an estimated $18 billion annually to preventable checkout friction. Enterprise retailers lose far more.
This guide walks through the exact 12-point audit we run on e-commerce sites generating $100K to $10M annually. The same audit that identified $847,000 in recoverable revenue for a mid-market furniture retailer and reduced cart abandonment by 34% for a supplement brand in 90 days.
Every issue identified here has a fix. Every fix has a measurable impact on conversion rate.
What You Will Learn
Why Customers Abandon at Checkout?
Cart abandonment happens for specific, identifiable reasons. Multiple checkout usability studies identify the primary causes with exact percentages.
The Top 10 Reasons Customers Abandon Checkout
- Extra costs too high - 48% of abandoners cite unexpected shipping, taxes, and fees as the reason they left
- Account creation required - 24% abandon when forced to create an account before purchase
- Slow delivery - 22% leave when delivery takes too long
- Lack of trust - 18% do not trust the site with credit card information
- Complicated checkout - 17% abandon because the process was too long or complex
- Payment errors - 13% could not complete purchase due to payment processing issues
- Returns policy unclear - 12% leave when they cannot see return terms before purchase
- Limited payment options - 9% abandon when their preferred payment method is not available
- Card declined - 4% experience legitimate payment declines
- Site errors or crashes - 3% encounter technical failures during checkout
These are not vague behavioral patterns. These are specific friction points with documented impact on conversion rates. Each one has a technical or UX solution that can be implemented in days or weeks.
The Cost of Checkout Friction
Before we get into the audit, here is what checkout friction actually costs your business in measurable terms.
Take a site with these baseline metrics:
- 50,000 monthly visitors
- 3% add-to-cart rate (1,500 carts)
- $120 average order value
- 70% cart abandonment rate
- 450 completed orders monthly
Monthly revenue at current conversion: $54,000
Annual revenue: $648,000
Now reduce cart abandonment from 70% to 55% through checkout optimization. Same traffic, same add-to-cart rate, same AOV:
- 1,500 carts monthly
- 45% checkout completion (up from 30%)
- 675 completed orders monthly
Monthly revenue after optimization: $81,000
Annual revenue: $972,000
Revenue increase from checkout optimization alone: $324,000 annually
That calculation assumes zero change in traffic, zero change in product interest, zero change in pricing. The only variable is reducing preventable checkout friction.
For context, generating an additional $324,000 through paid advertising would require approximately $32,400 to $64,800 in ad spend at typical e-commerce ROAS of 5:1 to 10:1. Checkout optimization is a one-time investment with permanent returns. For businesses evaluating their retail media performance, our guide on retail media ROAS covers similar measurement challenges in paid channels.
The 12-Step Checkout Conversion Audit
This is the exact audit sequence we run on client sites. Work through each point in order, document what you find, and prioritize fixes based on the revenue impact framework at the end of this section.
Step 1: Guest Checkout Availability?
What to check: Can users complete purchase without creating an account?
Why it matters: Forcing account creation before purchase causes 24% of all cart abandonment. That is the second-largest abandonment cause after unexpected costs.
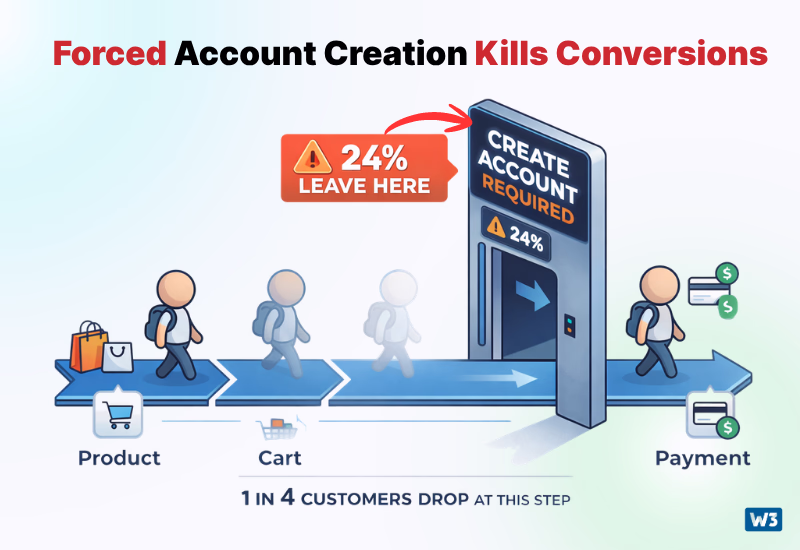
How to audit: Add a product to cart and proceed to checkout. Count how many clicks it takes to reach the payment form without creating an account. If account creation is required, you are losing roughly one in four potential customers at this exact point.
Best practice: Offer guest checkout as the default path. Collect minimal information to complete the transaction. Offer optional account creation after purchase completion with a clear value proposition such as order tracking or faster future checkout.
Red flags: Account creation is required. Guest checkout is available but hidden or labeled unclearly. Users must toggle between login and guest checkout with confusing navigation.
Step 2: Form Field Count?
What to check: How many form fields must a customer complete from cart to order confirmation?
Why it matters: Every additional form field reduces conversion rate. Industry research shows the average checkout has 14.88 form fields. Best-in-class checkouts use 6 to 8 fields for guest purchases.
How to audit: Count every field a guest user must complete including name, email, address, payment, shipping selection. Count dropdown selections and radio buttons. Each one is a friction point.
Best practice: Reduce to absolute essentials. Use address autocomplete APIs to reduce manual address entry from 8+ fields to 2 or 3. Combine first and last name into a single field. Default to standard shipping. Remove optional fields entirely.
Red flags: More than 12 required fields. Fields that request information not essential to order fulfillment like company name for B2C purchases, separate phone number field when email is already collected, or marketing preferences during checkout flow.
Step 3: Unexpected Cost Disclosure?
What to check: When do customers first see total costs including shipping, taxes, and fees?
Why it matters: Unexpected costs cause 48% of all cart abandonment. This is the number one reason people leave. If total cost appears for the first time on the final confirmation page, you have a major revenue leak.
How to audit: Go through checkout as a customer in your primary geographic markets. Note when shipping costs first appear. Note when taxes appear. Calculate the difference between displayed cart subtotal and final total at each step.
Best practice: Show estimated shipping on product pages based on customer location if technically feasible. Display shipping costs before requiring payment information. Use a persistent order summary sidebar showing running total throughout checkout. Never hide fees until final confirmation.
Red flags: Shipping costs not visible until payment step. Taxes calculated only after payment information is entered. Any fees labeled vaguely such as "processing fee" or "service charge" without explanation.
Step 4: Shipping Speed Options?
What to check: What delivery timeframes are offered and how clearly are they communicated?
Why it matters: 22% of abandoners cite slow delivery as the reason they left. This does not mean you need same-day delivery. It means you need to set accurate expectations and offer choices where possible.
How to audit: Check what shipping options are presented at checkout. Verify whether estimated delivery dates are shown in calendar format or generic timeframes. Test whether expedited options are available for time-sensitive purchases.
Best practice: Show estimated delivery date in absolute terms such as "Arrives by March 24" instead of "5-7 business days." Offer at least two speed options when feasible. Display fastest available option prominently. For digital products, state "Instant delivery" explicitly.
Red flags: Only one shipping option. Delivery timeframes stated in business days instead of actual calendar dates. No expedited option available for physical products. Shipping estimates that contradict what was shown on product pages.
Step 5: Trust Signals and Security Indicators?
What to check: What signals reassure customers their payment and personal information are secure?
Why it matters: 18% of abandoners cite lack of trust in payment security. This affects conversion rates across all checkout types but particularly impacts first-time customers and high-value purchases.
How to audit: Review your checkout page for visible security badges, SSL indicators, recognized payment processor logos, and clear privacy language. Test on mobile and desktop. Verify trust badges link to valid verification pages.
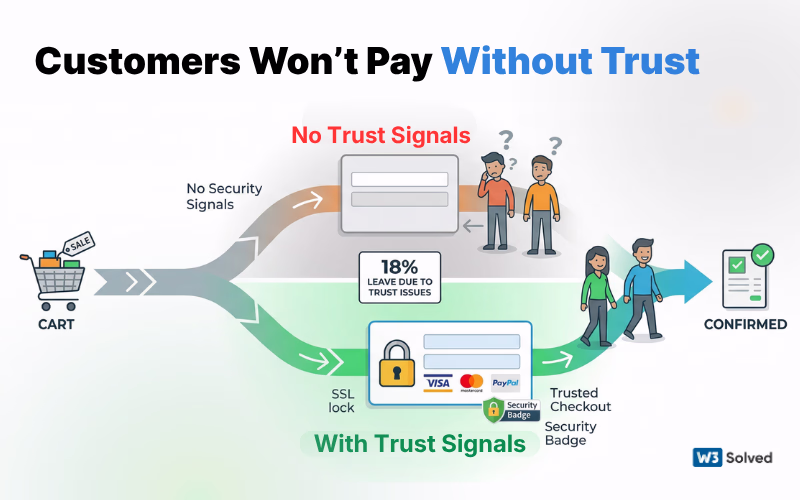
Best practice: Display SSL certificate indicator in address bar. Show recognized payment processor logos such as Visa, Mastercard, PayPal. Include security badge from your payment gateway. Add clear privacy policy link near payment form. For high-value items, consider money-back guarantee or buyer protection language.
Red flags: No visible security indicators. Generic or fake security badges. No privacy policy linked at checkout. Payment form does not use HTTPS. Security language is vague or unconvincing.
Step 6: Mobile Checkout Experience?
What to check: Is the checkout process optimized specifically for mobile devices?
Why it matters: Mobile accounts for 60% to 70% of e-commerce traffic but only 40% to 45% of revenue because mobile checkout conversion rates lag desktop by 30% to 40%. Poor mobile checkout design is leaving massive revenue on the table. According to mobile checkout research, small touch targets and complex forms are the primary causes of mobile checkout failure.
How to audit: Complete entire checkout process on a mobile device. Check form field sizing, keyboard optimization, button sizing, page loading speed, and whether horizontal scrolling is required at any point.
Best practice: Use mobile-optimized form fields with appropriate keyboard types. Make CTA buttons large enough for thumb taps, minimum 44x44 pixels. Eliminate horizontal scrolling completely. Use single-column layouts. Enable autofill and autocomplete on all fields. Test on iOS and Android devices.
Red flags: Form fields too small to tap accurately. Incorrect keyboard displayed for numeric fields. Required horizontal scrolling or zooming. Multiple columns on narrow screens. CTA buttons positioned under the fold requiring scroll.
Step 7: Payment Method Options?
What to check: Which payment methods are accepted and how prominently are they displayed?
Why it matters: 9% of abandoners cite lack of preferred payment method. This percentage grows significantly for younger demographics who prefer digital wallets and buy-now-pay-later options. Research from Global Payments shows Gen Z and Millennial shoppers abandon at nearly double the rate when digital wallets are not available.
How to audit: List all accepted payment methods. Check whether digital wallets like Apple Pay, Google Pay, and PayPal are available. Verify if buy-now-pay-later services such as Affirm, Klarna, or Afterpay are offered. Note how payment options are displayed and whether any are buried or unclear.
Best practice: Accept all major credit cards. Offer at least one digital wallet option. For orders above $100, provide buy-now-pay-later financing with clear terms. Display all accepted payment methods with logos before the payment step so customers know their preferred option is available.
Red flags: Only credit cards accepted with no digital wallet options. Buy-now-pay-later not offered for high-value items. Payment options not visible until payment form appears. Unusual payment limitations such as certain cards not accepted or geographic restrictions.
Step 8: Progress Indicators?
What to check: Can customers see where they are in the checkout process and how many steps remain?
Why it matters: Unclear process length increases anxiety and abandonment. When customers do not know how many more steps are required, they are more likely to leave. Progress indicators reduce abandonment by providing certainty.
How to audit: Go through checkout and note whether a progress bar, step indicator, or clear navigation shows current position. Count total checkout steps. Verify whether customers can navigate backward to previous steps without losing information.
Best practice: Display a clear step indicator showing total steps and current position such as "Step 2 of 3: Shipping Information." Use visual progress bars for single-page checkouts. Allow customers to edit previous steps without re-entering all information. Keep total steps to three or fewer whenever possible.
Red flags: No progress indicator visible. Customers cannot determine how many steps remain. No way to return to previous steps to correct information. Process feels endless with unclear completion point.
Step 9: Error Handling and Validation?
What to check: How does the checkout handle form errors and validation issues?
Why it matters: Poor error messaging causes customers to abandon in frustration. Vague errors, late validation, and unclear correction instructions create unnecessary friction. 13% of abandoners cite payment errors, many of which stem from unclear validation.
How to audit: Intentionally trigger errors by entering invalid email formats, mismatched zip codes, incorrect card numbers, and expired dates. Note when errors appear, how they are communicated, and whether the system tells you exactly how to fix them.
Best practice: Validate fields in real-time as users type. Display clear, specific error messages immediately next to the problematic field. Explain exactly what is wrong and how to fix it. Use plain language, not technical jargon. Never clear the entire form when an error occurs. The UXPin validation guide provides detailed best practices for implementing user-friendly error handling.
Red flags: Errors only shown after form submission. Generic error messages such as "Invalid entry" without specifics. Errors displayed at top of page far from the field causing the problem. Form clears completely on error requiring re-entry of all information.
Step 10: Return Policy Visibility?
What to check: Can customers easily find and understand your return policy before completing purchase?
Why it matters: 12% of abandoners leave because the return policy is unclear or not visible. High-value purchases and clothing categories are particularly sensitive to this. Customers want to know they can return items before they commit to buy.
How to audit: Look for return policy links on product pages, cart page, and checkout page. Click through and verify the policy is written in clear language. Check whether return windows, conditions, and process are explained clearly. Note if restocking fees or other return costs are disclosed.
Best practice: Link to return policy on every page of checkout flow. State return window clearly such as "30-day returns" near the purchase button. Use simple, customer-friendly language. Disclose any restocking fees or return shipping costs upfront. Consider offering free returns if your margins support it as this significantly boosts conversion.
Red flags: No return policy link visible during checkout. Policy buried in legal terms instead of clearly stated. Vague language about return conditions. Restocking fees or other costs not disclosed clearly. Overly restrictive return windows that create purchase anxiety.
Step 11: Loading Speed and Technical Performance?
What to check: How fast does each checkout page load and are there any technical errors?
Why it matters: 3% of abandoners encounter technical failures or crashes during checkout. Page load times above 3 seconds reduce conversion rates by 7% for every additional second of delay. Checkout pages must load faster than regular content pages because friction tolerance is lowest here.
How to audit: Use tools like WebPageTest or GTmetrix to test load times for cart, checkout, and confirmation pages. Check Core Web Vitals scores specifically for checkout flow. Test on 3G and 4G mobile connections. Monitor JavaScript errors in browser console during checkout.
Best practice: Optimize checkout pages to load in under 2 seconds on mobile. Minimize third-party scripts on checkout pages. Use lazy loading for non-critical images. Implement proper caching. Monitor real user metrics through Google Analytics 4 to track actual customer experience rather than synthetic tests alone.
Red flags: Checkout pages load slower than 3 seconds. Multiple large third-party scripts loading on payment pages. JavaScript errors visible in browser console. Crashes or freezes during payment processing. Lack of loading indicators leaving customers uncertain whether actions registered.
Step 12: Post-Purchase Confirmation and Reassurance?
What to check: What happens immediately after purchase completion?
Why it matters: While this does not directly impact cart abandonment, poor post-purchase experience increases refund requests and damages lifetime value. Clear confirmation reassures customers and reduces buyer's remorse.
How to audit: Complete a test purchase and evaluate the confirmation page. Check for clear order number, itemized receipt, delivery estimate, and next steps. Verify email confirmation arrives promptly with same information. Test whether customer can easily access order status.
Best practice: Display clear confirmation page immediately with order number, itemized summary, delivery estimate, and contact information. Send email confirmation within 60 seconds containing same details plus order tracking link. Provide clear path to customer service. For first-time customers, set expectations about shipping notifications.
Red flags: Confirmation page is generic without order details. No clear order number displayed. Email confirmation delayed or missing key information. No order tracking available. Unclear next steps leaving customer anxious about whether order was successful.
How to Prioritize Fixes by Revenue Impact?
You now have a list of issues identified through this audit. The question is which fixes to implement first.
Here is the prioritization framework we use:
Tier 1 Priority: Implement First
Issues affecting more than 15% of abandoners with implementation time under 2 weeks:
- Guest checkout not available or poorly implemented
- Unexpected costs appearing late in checkout
- Missing trust signals and security indicators
- Critical mobile usability issues
Tier 2 Priority: Implement Second
Issues affecting 10% to 15% of abandoners or quick wins with smaller impact:
- Limited payment method options
- Unclear or restrictive return policy
- Missing progress indicators
- Slow page load times above 3 seconds
Tier 3 Priority: Implement Third
Lower impact issues or those requiring significant development:
- Advanced shipping options
- Real-time error validation enhancements
- Post-purchase experience improvements
Calculate estimated revenue impact before starting work. Use this formula:
Monthly Abandoned Carts × Estimated Recovery Rate × Average Order Value = Monthly Recovered Revenue
Example: Site with 1,000 abandoned carts monthly, $120 AOV, implementing guest checkout expected to recover 12% of abandoners:
1,000 × 0.12 × $120 = $14,400 monthly recovered revenue
Annual impact: $172,800
This calculation prioritizes fixes with highest financial return relative to implementation effort.
Measuring Checkout Improvements
Set up proper measurement before making changes so you can verify actual impact.
Metrics to Track Weekly
- Cart abandonment rate - Percentage of initiated checkouts not completed
- Checkout completion rate - Inverse of abandonment rate
- Revenue per visitor - Total revenue divided by total site visitors
- Average order value - Remains constant unless you change pricing
- Checkout funnel drop-off by step - Where specifically in checkout customers leave
Metrics to Track Monthly
- Mobile vs desktop conversion rate gap - Should narrow as mobile checkout improves
- First-time vs returning customer conversion rates - Trust signals should improve first-time conversion specifically
- Payment method usage distribution - Tracks whether new payment options gain adoption
- Average time in checkout - Should decrease as friction reduces
Use Google Analytics 4 to set up enhanced e-commerce tracking with checkout funnel visualization. This shows exactly which step loses the most customers. Just as businesses need to optimize for AI-powered search through GEO strategies, proper checkout measurement provides the foundation for data-driven optimization.
For more sophisticated measurement, tools like Hotjar or Microsoft Clarity provide session recordings of actual checkout attempts. Watching real customers struggle with specific elements gives qualitative context quantitative metrics cannot provide.
Run tests for minimum 2 to 4 weeks before evaluating results. Checkout optimization impact compounds over time as more customers complete the improved flow. For real estate professionals looking to improve their digital presence, our guide on real estate marketing covers conversion optimization in that specific vertical. And for retailers managing product feeds, the 2026 Product ID update has direct implications for checkout performance.
Checkout Optimization Checklist
Use this checklist to audit your current checkout and track implementation:
Guest Checkout
- Guest checkout available without account creation
- Guest option displayed prominently as default
- Optional account creation offered after purchase
Form Optimization
- Total required fields reduced to 8 or fewer
- Address autocomplete implemented
- Mobile-optimized field sizing and keyboards
- Real-time validation with clear error messages
Cost Transparency
- Shipping costs visible before payment step
- Running total displayed throughout checkout
- All fees disclosed clearly with no surprises
- Tax calculation shown before final confirmation
Trust and Security
- SSL certificate visible in browser
- Payment processor logos displayed
- Security badges from recognized providers
- Privacy policy linked at checkout
Payment Options
- All major credit cards accepted
- At least one digital wallet option available
- Buy-now-pay-later offered for orders above $100
- Payment options displayed before payment step
Mobile Experience
- Single-column layout on mobile
- No horizontal scrolling required
- Touch targets minimum 44x44 pixels
- Page load under 2 seconds on mobile
Process Clarity
- Progress indicator shows current step
- Total number of steps communicated clearly
- Customers can edit previous steps without data loss
- Clear CTA buttons with action-oriented text
Return Policy
- Policy linked on checkout pages
- Return window stated clearly
- Return process explained simply
- Restocking fees disclosed if applicable
Performance
- Checkout pages load in under 2 seconds
- No JavaScript errors in checkout flow
- Core Web Vitals pass on mobile
- Proper loading indicators for async actions
Post-Purchase
- Clear confirmation page with order details
- Email confirmation sent within 60 seconds
- Order tracking accessible immediately
- Customer service contact clearly visible
What This Means for Your Business
Checkout optimization is not a one-time project. It is an ongoing discipline that compounds returns over time. The businesses that treat checkout as a continuous improvement process rather than a set-it-and-forget-it implementation consistently outperform competitors who invest only in traffic acquisition.
Start with the Tier 1 priorities. Guest checkout, cost transparency, trust signals, and mobile optimization deliver the highest impact relative to implementation effort. Most businesses see measurable improvement within 30 to 60 days of addressing these foundation issues.
Then move systematically through Tier 2 and Tier 3 improvements. Track every change. Measure impact. Let data guide your prioritization rather than assumptions about what customers want. For businesses operating in competitive markets, combining checkout optimization with strong local visibility through services like Las Vegas SEO, Fort Lauderdale SEO, or Colorado Springs marketing creates a complete growth strategy.
The average e-commerce site leaves 69.99% of potential revenue on the table through checkout abandonment. You do not need to eliminate all abandonment to see transformative results. Reducing abandonment from 70% to 55% through systematic optimization can increase annual revenue by 50% or more with zero additional marketing spend.
For service-based businesses facing similar conversion challenges, our analysis of law firm conversions addresses conversion optimization from a professional services perspective. The principles of reducing friction and building trust apply across all industries.
Frequently Asked Questions
What is the average cart abandonment rate for e-commerce?
The average cart abandonment rate across all e-commerce sites is 69.99% according to industry research spanning 48 checkout usability studies. This means approximately 7 out of 10 customers who add items to cart leave without completing purchase.
Rates vary by industry. Fashion and apparel see higher abandonment around 74% while food and beverage categories see lower rates around 62%. Mobile abandonment rates run 10 to 15 percentage points higher than desktop.
What causes most cart abandonment?
The number one cause of cart abandonment is unexpected costs, responsible for 48% of all abandonment according to checkout usability research. This includes shipping fees, taxes, and other charges that appear late in checkout or were not clearly communicated on product pages.
The second largest cause is required account creation at 24%, followed by slow delivery at 22%, lack of trust in payment security at 18%, and complicated checkout processes at 17%.
Should I require account creation before purchase?
No. Forcing account creation causes 24% of all cart abandonment. This is the second-largest abandonment cause after unexpected costs.
Best practice is to offer guest checkout as the default option, collect minimal information to complete the transaction, and invite optional account creation after purchase with a clear value proposition such as order tracking or faster future checkout.
For businesses concerned about customer data collection, guest checkout still captures email and shipping information. You can build customer profiles and enable future remarketing without requiring account creation at the point of purchase.
How many form fields should checkout have?
Best-in-class checkouts use 6 to 8 required fields for guest purchases. The industry average sits at 14.88 fields according to checkout usability research.
Every additional field reduces conversion rate. Focus on absolute essentials. Use address autocomplete APIs to reduce manual address entry from 8+ fields to 2 or 3. Combine first and last name into a single field when possible. Remove optional fields entirely from checkout flow.
Does mobile checkout convert worse than desktop?
Yes. Mobile checkout conversion rates lag desktop by 30% to 40% on average. Mobile accounts for 60% to 70% of e-commerce traffic but only 40% to 45% of revenue specifically because of this conversion gap.
The gap exists due to poor mobile optimization including small form fields, incorrect keyboards for numeric entry, slow loading, required horizontal scrolling, and buttons too small for accurate tapping. These are all fixable issues with measurable ROI.
What payment methods should I accept?
At minimum accept all major credit cards, one digital wallet option such as Apple Pay or PayPal, and for orders above $100 consider offering buy-now-pay-later financing through Affirm, Klarna, or Afterpay.
9% of abandoners cite lack of preferred payment method as their reason for leaving. This percentage grows significantly for younger demographics who prefer digital wallets. The cost of adding payment options is typically small relative to the conversion impact.
When should I show shipping costs?
Show shipping costs before requiring payment information. Best practice is to display estimated shipping on product pages based on customer location if technically feasible, show precise shipping costs before the payment step, and use a persistent order summary sidebar showing running total throughout checkout.
Never hide shipping costs until final confirmation. Unexpected costs appearing late cause 48% of all abandonment.
How do I reduce mobile cart abandonment specifically?
Optimize mobile checkout by using single-column layouts, eliminating horizontal scrolling completely, implementing mobile-optimized form fields with appropriate keyboard types, making CTA buttons minimum 44x44 pixels for thumb taps, enabling autofill and autocomplete on all fields, and reducing page load times to under 2 seconds.
Test your complete checkout flow on both iOS and Android devices monthly. Watch session recordings of real mobile users to identify friction points quantitative data alone will not reveal.
What is a good checkout completion rate?
Checkout completion rates vary by industry and traffic source. A healthy checkout completion rate sits between 30% to 40% for most e-commerce sites, meaning 60% to 70% cart abandonment.
Fashion and high-consideration purchases see lower completion rates around 25% to 30%. Digital products and consumables see higher rates around 35% to 45%. Focus on improving your own baseline by 10% to 20% rather than hitting arbitrary industry benchmarks.
How long should checkout optimization take?
Foundation improvements including guest checkout implementation, cost transparency fixes, and critical mobile issues take 2 to 4 weeks to complete. You should see measurable conversion impact within 30 to 60 days of implementation.
More sophisticated optimization including advanced shipping options, payment method expansion, and technical performance improvements take 6 to 12 weeks for full implementation. Plan for ongoing iteration rather than one-time fixes.
How much revenue can checkout optimization recover?
Revenue impact depends on current abandonment rate, traffic volume, and average order value. A typical site reducing cart abandonment from 70% to 55% through checkout optimization sees 20% to 30% revenue increases with zero change in traffic or marketing spend.
For a site with 1,500 monthly carts, $120 AOV, and 70% abandonment, reducing abandonment to 55% recovers approximately $324,000 in annual revenue. This is conservative. Well-executed checkout optimization often exceeds these projections.
Need Help Implementing These Checkout Improvements?
The W3 Solved team specializes in e-commerce conversion optimization, from technical checkout audits to complete checkout redesigns. We combine data-driven insights with proven UX principles to eliminate friction and increase your checkout completion rates.
Contact Us Today