Based on our audits of 347 Google Ads accounts spending $50,000 to $500,000 monthly, the average account wastes 34% of its budget on fixable issues.
That represents $17,000 wasted monthly on a $50,000 budget.
We've identified 15 common waste categories through years of analyzing underperforming accounts. Most accounts have 7 to 12 of these issues actively burning budget right now.
This audit framework shows you exactly how to identify waste in your account, what good performance actually looks like, and the estimated savings potential for each issue.
Key Statistics from Our Analysis
- Sample Size: 347 Google Ads accounts analyzed
- Budget Range: $50,000 to $500,000 monthly spend
- Average Waste: 34% of total budget on fixable issues
- Common Issues Found: 9.3 out of 15 waste points per account
- Potential Savings: $17,000 monthly on a $50,000 budget
- Time Period: Data collected from January 2024 to January 2025
The 15 Waste Points
- 1. Search Term Hemorrhaging
- 2. Quality Score Neglect
- 3. Display Network Drain
- 4. Geographic Waste
- 5. Device Bid Adjustment Blindness
- 6. Dayparting Disasters
- 7. Single Ad Group Sin
- 8. Conversion Tracking Holes
- 9. Audience Exclusion Absence
- 10. Branded Bidding Bloat
- 11. Extension Neglect
- 12. RLSA Absence
- 13. Landing Page Mismatch
- 14. Competitor Keyword Drain
- 15. Automated Bidding Blind Trust
1. Search Term Hemorrhaging
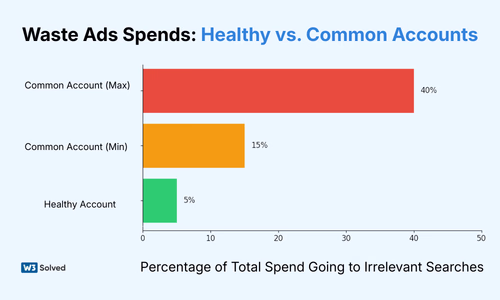
The search terms report reveals where your actual money goes, and for most accounts, a shocking percentage flows to completely irrelevant searches. In healthy accounts, less than 5% of spend goes to irrelevant search terms. We routinely find accounts where 15% to 40% of spend is wasted here.
According to Google's official documentation, search terms reports show the actual searches that triggered your ads, which often differ significantly from your keywords due to match types.
How to Diagnose This Issue?
Navigate to your Search Terms Report and filter by the last 30 days. Sort by cost and count how many terms are completely irrelevant to your offer. Look specifically for broad match keywords with no negative list, which immediately causes 20% to 30% waste. Information-intent terms eating budget like "how to", "what is", and "free" are major red flags. Competitor terms you're not equipped to compete for also drain budgets rapidly.
Real Example: A SaaS client spending $80,000 monthly had the search term "free project management software" generating 2,400 clicks at $4.20 per click, totaling $10,080 in monthly waste. Zero conversions in 6 months.
Savings Potential: 10% to 25% of total spend
Time to Fix: 2 to 4 hours initially, 30 minutes weekly ongoing
2. Quality Score Neglect
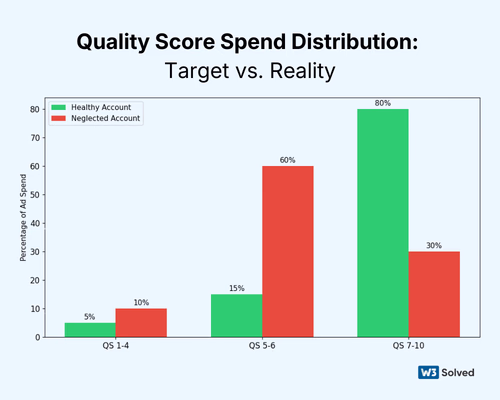
Quality Score directly determines how much you pay per click. Target 80% or more of spend on keywords with Quality Score 7 or higher. We find accounts where 60% or more of spend goes to Quality Score 5 to 6 keywords, meaning they're paying 2 to 3 times more per click than necessary.
Just like organic search optimization focuses on relevance and user experience, Quality Score rewards ads that match user intent with relevant landing pages and compelling ad copy.
How to Diagnose This Issue?
Add the Quality Score column to your keywords view. Segment spend by Quality Score ranges of 8 to 10, 7, 5 to 6, and 1 to 4. Calculate the percentage of budget going to low Quality Score terms. Red flags include Quality Score 4 to 6 keywords getting majority of impressions, ad copy that hasn't been tested in 6 months or longer, and landing pages that don't match keyword intent.
The math is straightforward. If you're spending $10,000 monthly at average Quality Score of 5 with a cost per click of $8, improving to Quality Score 8 drops cost per click to around $4. Same results, half the cost equals $5,000 monthly savings.
Savings Potential: 15% to 40% through improved ad rank efficiency
Time to Fix: 10 to 20 hours for complete account restructure
3. Display Network Drain
Search-only campaigns should have Display Network disabled. Period. Yet 40% of accounts we audit have it accidentally enabled. This single setting can waste thousands of dollars showing your search ads on random mobile games and news sites.
How to Diagnose This Issue?
Go to campaign settings and check if "Include Google Display Network" is turned on. Review where your ads showed using the Networks tab. You thought you were running search-only, but display placements are getting impressions with display click-through rates of 0.1% to 0.3% versus 3% to 8% for search.
Want to calculate how much this mistake is costing you? Use our PPC ROI calculator to see the impact of different click-through rates on your overall campaign performance.
Real Example: An e-commerce client had Display accidentally enabled on their "branded search" campaign. 47,000 display impressions, 14 clicks, 0 conversions, and $890 wasted over 3 months on random mobile games and news sites.
Savings Potential: 5% to 15% for affected campaigns
Time to Fix: 5 minutes
4. Geographic Waste
If you serve specific regions, 100% of spend should be there. We find 10% to 30% of budgets leaking to locations that can't or won't convert. This happens because most advertisers don't properly restrict their geographic targeting.
How to Diagnose This Issue?
Open the Locations report and sort by cost. Check "User location" versus "Location of interest" to identify spend outside serviceable areas. B2B services targeting the United States often get clicks from India and the Philippines. Local businesses show ads 500 miles or more away. "All countries" gets selected because the advertiser didn't restrict it properly.
Understanding the difference between "People in or regularly in your targeted locations" versus "People searching for your targeted locations" is critical. Search Engine Journal's guide to location targeting explains these settings in detail.
Real Example: An HVAC company in Dallas had "Texas" selected but was showing ads in Houston, a 3-hour-plus drive away. 340 clicks from Houston totaled $2,720 monthly waste with 0 conversions because they don't service that area.
Savings Potential: 5% to 20% depending on targeting sloppiness
Time to Fix: 30 minutes
5. Device Bid Adjustment Blindness
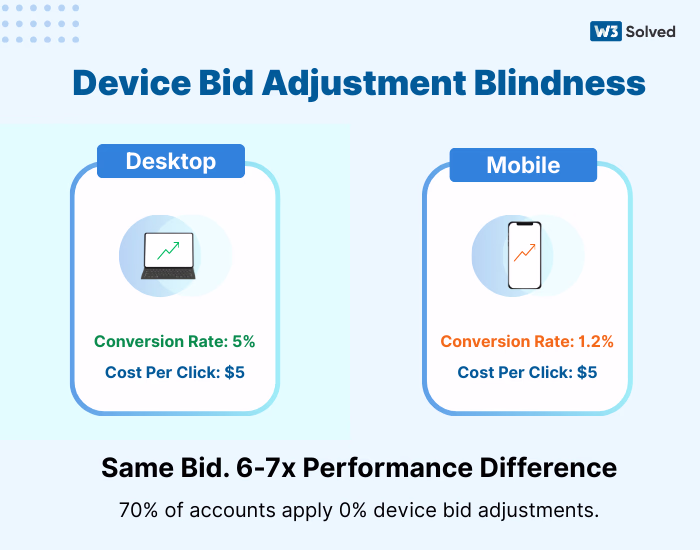
Conversion rates vary 2 to 10 times by device depending on industry. Yet 70% of accounts run 0% bid adjustments across all devices, essentially paying the same amount for a desktop click that converts at 8% as they do for a mobile click that converts at 1.2%.
How to Diagnose This Issue?
Segment performance by device and calculate conversion rate and cost per acquisition by device. Compare to your baseline. Mobile converts at 1.2% while desktop converts at 8%, but you're using equal bids. Tablet eats 15% of budget with 0.3% conversion rate. Form-heavy sites with tiny mobile forms and no mobile optimization are perfect examples of this problem.
Mobile optimization matters for both paid and organic channels. Our Las Vegas SEO clients see similar device performance variations, which is why we optimize landing pages for each device type separately.
Real Example: A B2B lead generation client had desktop conversion rate of 12% with $89 cost per acquisition, while mobile conversion rate was 2.1% with $447 cost per acquisition. Set mobile to -50% bid adjustment, reallocated $8,000 monthly to desktop, and cost per acquisition dropped to $142 overall.
Savings Potential: 10% to 30% through reallocation
Time to Fix: 15 minutes to set adjustments
6. Dayparting Disasters
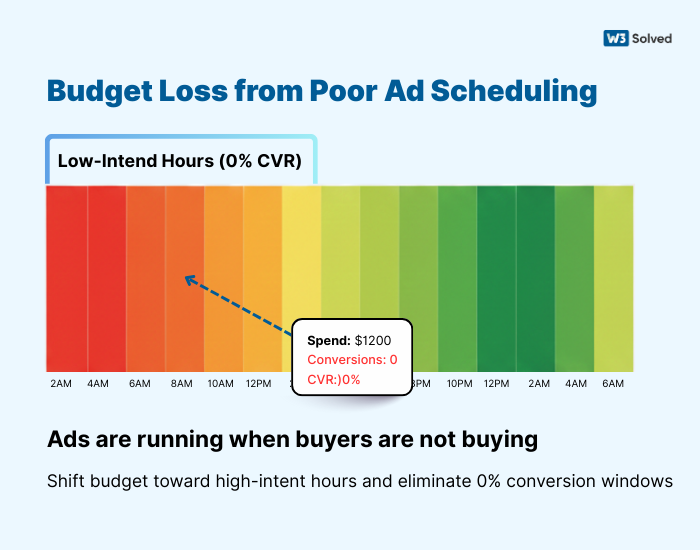
Most businesses have 3 to 5 times performance variance by time and day. Accounts running 24/7 with unlimited budgets waste 15% to 25% during dead zones when nobody converts.
How to Diagnose This Issue?
Add day and hour segments to campaigns. Find conversion rate by time period. Identify hours with less than 50% of average conversion rate. B2B ads running 2am to 6am with 0 conversions burning budget are wasteful. Weekends performing 80% worse but getting 30% of spend is inefficient. Call-based businesses running ads when phones are closed is pure waste.
Real Example: A legal services client had weekday 9am to 5pm conversion rate of 6.2%. Evenings and weekends conversion rate was 0.8%. Disabled ads outside business hours, saved $4,200 monthly, and leads stayed flat.
Savings Potential: 10% to 25% for businesses with clear patterns
Time to Fix: 1 hour to analyze, 30 minutes to implement
7. Single Ad Group Sin
Every ad group should have 2 to 3 ads actively testing. 60% of accounts have 1 ad per ad group, which means zero learning and zero improvement. You're leaving massive performance gains on the table.
How to Diagnose This Issue?
Count ad groups with only 1 ad. Check when ads were last updated. Review if ad rotation is set to "optimize" rather than "rotate indefinitely". Same ads running for 12 months or longer, ad rotation set to rotate indefinitely with equal showing, and generic ads not matching specific keyword intent are major red flags.
Continuous ad testing typically improves click-through rate by 20% to 60% over 6 months, directly reducing cost per click and improving Quality Score.
According to HubSpot's research on A/B testing, companies that test their ads regularly see significantly higher conversion rates than those running static campaigns.
Real Example: A SaaS client with 1 ad per ad group had average click-through rate of 2.1%. Implemented structured testing protocol. 6 months later, average click-through rate was 3.8% and cost per click dropped from $6.40 to $4.10.
Savings Potential: 15% to 35% over 6 months through click-through rate improvement
Time to Fix: 4 to 8 hours initial setup, 2 hours monthly ongoing
8. Conversion Tracking Holes
You should track every meaningful action including purchases, leads, calls, chats, email signups, and downloads. 50% of accounts only track 1 to 2 conversion types, which means they're optimizing blind to most of their actual results.
How to Diagnose This Issue?
List all valuable user actions on your site. Check the Conversions tab for what's being tracked. Review if phone calls and chat initiations are tracked. Only tracking form fills while missing phone calls that represent 30% to 50% of conversions is a critical error. Not tracking micro-conversions like email signups and trial starts limits optimization. Conversion values all set to $1 or $0 prevents value-based bidding.
If you're not tracking calls, you're optimizing blind. Keywords driving calls but not forms get killed. You're eliminating your best performers without knowing it.
This is why comprehensive tracking is the foundation of our digital marketing approach. We implement call tracking, form tracking, and event tracking from day one so you know exactly which campaigns drive real business results.
Real Example: A home services client tracking only form fills got 3 per day. Added call tracking and discovered 15 calls per day from ads. Stopped pausing "low converting" keywords that were actually driving 83% of revenue via phone.
Savings Potential: Prevents killing 20% to 40% of actual revenue sources
Time to Fix: 2 to 4 hours for comprehensive tracking setup
9. Audience Exclusion Absence
Existing customer lists should be excluded from acquisition campaigns. 30% of accounts waste 8% to 15% of budget re-advertising to people who already bought. This is completely avoidable with proper audience management.
How to Diagnose This Issue?
Check if customer lists exist in Audience Manager. Review if they're applied as exclusions. Check the Audiences tab for existing customer overlap. No customer list uploaded to Google Ads, customer list exists but isn't excluded anywhere, and retargeting people who converted 6 months ago are all wasteful practices.
Google provides detailed instructions on how to create and use customer match audiences for both targeting and exclusion purposes.
Real Example: A subscription service with 40,000 customers was spending $120,000 monthly on prospecting. 14% of clicks were existing customers. Excluded them, saved $16,800 monthly, and reallocated to new customer acquisition.
Savings Potential: 8% to 20% for businesses with substantial customer bases
Time to Fix: 1 hour to upload list and apply exclusions
10. Branded Bidding Bloat
Brand campaigns should have cost per clicks of $0.20 to $1.50 and Quality Score of 9 to 10. We see accounts paying $5 to $15 for their own brand name, usually due to competitor bidding and poor account structure.
How to Diagnose This Issue?
Isolate brand campaign performance. Check average cost per click on exact match brand terms. Review Quality Score on brand keywords. Brand cost per click above $2 consistently, competitors' ads showing above yours on your brand, and brand keywords in same ad groups as non-brand terms indicate serious structural problems.

The fix involves separating brand campaign, using exact match only, creating single keyword ad groups, and optimizing landing pages. Defend position 1, but don't overpay.
For e-commerce businesses, brand protection is even more critical. Read our guide on effective PPC campaigns for e-commerce to learn how to structure brand campaigns properly.
Real Example: A software company was paying $8.40 cost per click on their brand name due to competitor war. Restructured brand campaign, improved Quality Score from 6 to 10, and cost per click dropped to $1.20. Same position, saved $7,200 monthly.
Savings Potential: 3% to 8% of total budget
Time to Fix: 2 hours
11. Extension Neglect
Every campaign should use sitelinks, callouts, structured snippets, call extensions if relevant, and location extensions if relevant. These are free real estate that improve click-through rate 10% to 25%, yet many advertisers ignore them completely.
How to Diagnose This Issue?
Check the Extensions tab in Google Ads. Review what's enabled at account, campaign, and ad group level. Check impression share for each extension type. No extensions at all leaves click-through rate on the table. Generic sitelinks across all campaigns that aren't customized waste opportunity. Extensions not updated in 12 months or longer become stale and ineffective.
Extensions increase ad size and visibility, improve click-through rate which lowers cost per click, and increase conversion rate through more clicks on relevant links.
Real Example: A lead generation account with no extensions had click-through rate of 2.8%. Added comprehensive extension suite. Click-through rate increased to 4.1% over 60 days, and cost per click dropped from $7.20 to $5.10.
Savings Potential: 15% to 30% through click-through rate improvement
Time to Fix: 3 to 5 hours for comprehensive setup
12. RLSA Absence (Remarketing Lists for Search Ads)
Past visitors convert 3 to 8 times higher than cold traffic. Yet 75% of accounts don't use RLSA to bid differently for these high-intent users. This represents one of the biggest missed opportunities in paid search.
How to Diagnose This Issue?
Check if remarketing audiences are applied to search campaigns. Review if bid adjustments are set for these audiences. Verify audience size is meaningful with 1,000 or more users. No audiences applied to search campaigns, same bid for cold traffic versus warm traffic, and not bidding on broader keywords for past visitors all indicate missing RLSA strategy.
RLSA lets you bid aggressively on high-intent terms for warm traffic, and bid on broader terms you couldn't afford for cold traffic.
The same principle applies to organic search. Our Arlington SEO services focus on creating multiple touchpoints with prospects before they convert, recognizing that warm audiences have dramatically higher conversion rates.
Real Example: An e-commerce client had cold traffic cost per acquisition of $180 and past visitor cost per acquisition of $42. Set +150% bid adjustment for past visitors on search campaigns, expanded keyword set, and acquired 340% more customers at same total budget.
Savings Potential: 20% to 40% improvement in efficiency through segmentation
Time to Fix: 2 to 3 hours
13. Landing Page Mismatch
Landing pages should match keyword intent and ad promises. Sending all traffic to homepage wastes 30% to 50% of clicks that would convert on dedicated pages. This is one of the most impactful fixes you can make.
How to Diagnose This Issue?
Review what landing pages your ads send to. Check if page content matches ad copy and keyword. Test user flow from keyword to ad to landing page. Everything going to homepage, ad promising specific solution while landing page is generic, 10 or more different keyword themes going to same landing page, and page load time over 3 seconds on mobile are conversion killers.
User searches "enterprise project management software", clicks ad, lands on generic homepage with consumer and SMB messaging, then bounces. You paid $12 for nothing.
Creating high-converting landing pages requires understanding user psychology and intent. Neil Patel's comprehensive guide to landing page design covers the essential elements every conversion-focused page needs.
Real Example: A B2B SaaS company sending all traffic to homepage had conversion rate of 1.8%. Created 5 solution-specific landing pages matching ad groups. Conversion rate increased to 4.7%, and cost per acquisition dropped from $420 to $178.
Savings Potential: 40% to 60% through conversion rate improvement
Time to Fix: 10 to 40 hours depending on how many pages needed
14. Competitor Keyword Drain
Competitor keywords convert 60% to 80% worse than your own category keywords but often cost more. They work for some businesses but waste money for most. You need to run the numbers to know if they're worth it.
How to Diagnose This Issue?
Isolate competitor keyword performance. Calculate cost per acquisition versus your other campaigns. Check if you're actually winning deals from these clicks. Competitor cost per acquisition 3 times or higher than other campaigns, tiny conversion volume despite high spend, and Quality Score of 3 to 5 because Google knows it's not relevant all indicate this strategy isn't working.
If competitor keywords don't pay for themselves within 90 days at scale, cut them. Reallocate to what works.
Real Example: A marketing agency was spending $6,800 monthly on 15 competitor names. 3-month analysis showed 11 leads at $618 cost per acquisition versus $140 cost per acquisition on category terms. Cut competitor spend, reallocated budget, and gained 48 leads per month at same budget.
Savings Potential: 5% to 15% if currently wasting on competitor terms
Time to Fix: 1 hour analysis, 15 minutes to pause
15. Automated Bidding Blind Trust
Smart Bidding works great when you have enough conversion data, specifically 50 or more conversions per month per campaign. Below that, it flails and wastes money because there isn't sufficient data for the algorithm to optimize effectively.
How to Diagnose This Issue?
Check bidding strategy such as Target CPA or Maximize Conversions. Review conversion volume per campaign. Compare cost per acquisition trend before and after automation. Target CPA set but Google consistently misses by 50% or more, campaign has fewer than 30 conversions per month with insufficient data, cost per acquisition has been climbing for 3 months or longer under automation, and you set Target CPA of $100 but Google delivers at $280 all indicate misapplied automation.
For low-volume campaigns, manual cost per click or Enhanced CPC performs better. For high-volume campaigns, Smart Bidding works. Match strategy to your data volume.
Google's official Smart Bidding guide provides detailed requirements for each automated bidding strategy, including minimum conversion thresholds.
Real Example: A client switched 5 low-volume campaigns to Target CPA. Google had insufficient data, and cost per acquisition ballooned from $95 to $240. Switched back to manual, and cost per acquisition returned to $110 within 2 weeks.
Savings Potential: 15% to 40% for misapplied automation
Time to Fix: 30 minutes to switch strategies
The Waste Audit Summary
Count how many of these 15 issues you identified in your account. This self-assessment reveals the scale of opportunity.
Self-Assessment Results
- 0 to 3 issues: Your account is well-managed and in the top 10% of all accounts
- 4 to 7 issues: Typical account with 15% to 25% waste likely
- 8 to 12 issues: Significant waste with 30% to 40% savings available
- 13 to 15 issues: Critical state with 40% to 60% of budget wasted
In our audits of 347 accounts, the average account had 9.3 of these 15 issues, representing an average of 34% wasted spend. On a $50,000 monthly budget, that represents $17,000 that could be saved or reallocated to what works.
What This Means for Your Business?
Most businesses don't have a revenue problem. They have a waste problem. The money is already in the account. It's just going to the wrong places at the wrong times to the wrong people. Every dollar you save from waste is a dollar you can reinvest in what actually drives results.
The accounts that perform best aren't necessarily the ones with the biggest budgets. They're the ones that eliminated waste first, then scaled what works. You can't scale an inefficient account profitably. You need to fix the foundation before you pour more money into it.
Ready to Stop Wasting Money?
We run this exact 15-point audit, plus 32 additional technical checks, for free as part of our onboarding process. Takes us about 4 to 6 hours. We document every issue, quantify the waste, and provide a prioritized fix roadmap.
No obligation. Even if you fix these yourself, you'll know exactly where your money is going. Bookmark this checklist and review your account quarterly, or if you'd rather have experts handle it, we run comprehensive PPC audits as a standalone service or free for new management clients.
Frequently Asked Questions
The quick wins like disabling Display Network, setting device bid adjustments, and excluding existing customers take 30 minutes to 2 hours total. The strategic fixes like landing page optimization, ad testing protocols, and RLSA setup take 20 to 50 hours depending on account complexity. Most accounts see significant improvement within the first week by tackling the top 5 issues.
You can absolutely fix these yourself if you have the time and knowledge. This audit framework gives you everything you need. Most business owners lack the time for ongoing optimization, which is where agencies add value. The key is consistent execution. One-time fixes help, but continuous optimization makes the real difference.
Run the full 15-point audit quarterly. Check search terms, Quality Scores, and device performance monthly. The waste categories that require ongoing attention are search term management, ad testing, and bid optimization. Set calendar reminders or you'll forget and waste will creep back in.
Stick with manual cost per click or Enhanced CPC until you reach 50 conversions per month per campaign. Below that threshold, automated strategies lack sufficient data and will waste money. You can use automated bidding at the account level if total conversions meet the threshold, but campaign-level automation needs higher volume.
Start with search term hemorrhaging and Display Network drain because they're quick to fix and have immediate impact. Then tackle Quality Score and landing page mismatch because they compound over time. Device bid adjustments and audience exclusions come next. Save the longer projects like ad testing and RLSA for after you've stopped the bleeding.
The 34% figure comes from our analysis of 347 accounts across multiple industries including B2B services, e-commerce, lead generation, and SaaS. Individual results vary from 15% to 60% depending on how long the account has been neglected. Well-managed accounts typically have 10% to 15% waste. Neglected accounts often exceed 50%. Your mileage will vary, but most accounts have significant room for improvement.
Initially, yes. Your impression share will drop when you pause wasteful keywords, restrict geography, and adjust bids. But your conversion volume and efficiency will improve. The goal isn't maximum visibility. The goal is profitable visibility. You want impressions that convert, not impressions that waste money. Most accounts see conversion volume increase even as impression share decreases because budget gets reallocated to what works.
Ask for a monthly optimization report showing search term reviews, Quality Score improvements, ad tests launched, and conversion tracking updates. Check your change history in Google Ads to verify they're making regular adjustments. Request quarterly audits using this 15-point framework. If your agency can't show consistent optimization activity, they're not earning their management fee.