Your Walmart dashboard shows 4.2x ROAS. Amazon reports 5.8x. Target says 3.5x. You spent $200,000 across all three platforms last quarter.
Quick math suggests you generated over $2.7 million in attributed revenue. Your CFO asks one question: "How much of that would've happened anyway?"
You don't have an answer. Most brands running retail media don't. The problem is US advertisers will spend $71.09 billion on retail media in 2026, and the vast majority are making budget decisions based on numbers that don't reflect reality.
In This Article
The Core Measurement Problem
Retail media networks operate as closed ecosystems. Each platform is both the seller of advertising inventory and the provider of measurement for that inventory. There's no independent oversight forcing consistency.
Amazon reports ROAS based on their attribution methodology. Walmart uses a different approach. Target's Roundel calculates it differently still. According to research published by Ciente, the IAB and Media Rating Council have worked on retail media measurement standards for years, but progress remains slow because retailers have no commercial incentive to make their performance directly comparable to competitors.
The result is that brands running campaigns across multiple retail media networks end up comparing numbers that are fundamentally incompatible. You're not comparing apples to oranges, you're comparing completely different calculation methodologies that each network designed to maximize their reported performance.
The Double-Counting Problem
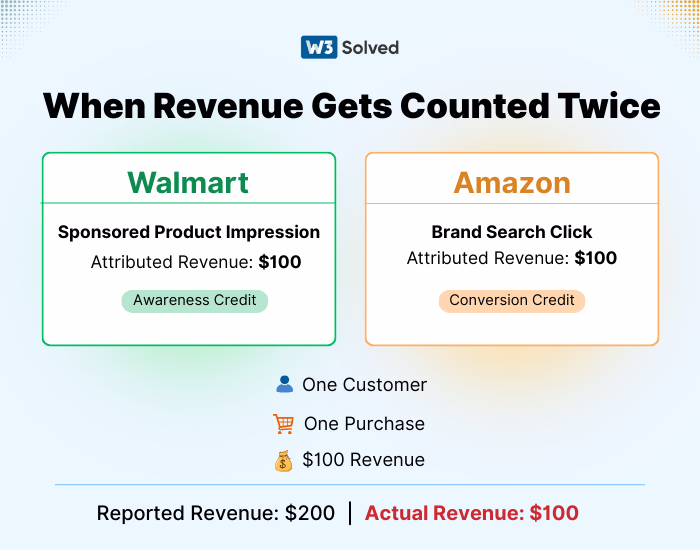
When a customer sees your sponsored product on Walmart.com, later searches for your brand on Amazon, and completes the purchase there, both platforms will claim credit. Walmart counts the impression as driving awareness. Amazon attributes the sale to the search click.
This multi-touchpoint attribution problem extends beyond retail media. As covered in our guide on Generative Engine Optimization, brands now need to track how AI-powered search tools like ChatGPT and Perplexity influence purchase decisions alongside traditional retail media touchpoints.
Your total reported ROAS across both platforms includes this customer twice. Multiply this across thousands of transactions, and your aggregated ROAS number becomes meaningless. According to industry research on retail media growth, this attribution overlap creates an inflated view of performance that hides the true incremental value of each network.
The same customer seeing ads on multiple networks before purchasing isn't generating 3x or 4x the revenue, they're making one purchase that gets credited multiple times across your measurement stack.
Reality Check: Most brands running 3-5 retail media networks simultaneously have no standardized framework for comparing performance. Every budget allocation decision becomes educated guesswork rather than data-backed strategy. The same measurement challenges that plague retail media affect Google Ads campaigns, where platform-reported metrics often mask inefficiencies.
Why ROAS Alone Fails?
ROAS measures revenue attributed to ads divided by ad spend. A 5:1 ROAS means you generated $5 in revenue for every $1 spent on advertising. The metric is simple, trackable, and almost completely misleading when used alone.
The fundamental problem is that ROAS cannot tell you what percentage of those sales would have occurred without any advertising. According to Albertsons Media Collective research, when customers search for a specific brand on a retail site, purchase intent already exists. ROAS assigns full credit to the ad, but the customer was already looking to buy.
The Margin Problem
ROAS looks at revenue, not profit. If you spend $1 and generate $10 in sales with a 5:1 ROAS, that sounds excellent until you account for incrementality and margin.
According to Path to Purchase Institute research, if only 40% of that $10 is truly incremental and your margin on those sales is 30%, you spent $1 and got back $1.20, a 20% return on investment. Whether that's acceptable depends on your business model and alternative investment options, but it's dramatically different from the 400% implied by ROAS alone.
Billy May, CEO of Brooklinen, explained this clearly at NRF 2026: "ROAS masks a lot of problems. If your email and customer marketing program is extremely efficient and that's blended into your numbers, it actually means your performance marketing is underperforming on an incremental basis."
What Industry Leaders Are Saying?
Josh Krepon, President of DTC at Steven Madden, stopped using the term "return on ad spend" entirely. "I've stopped using ROAS as return on ad spend, it's just revenue on ad spend," he said at the same NRF panel. "If you really want a measurement vehicle for what the return on your spend was, that's helpful, but at this point it has almost no bearing on how we look at spend."
Saiful Islam, CEO of W3 Solved, is equally direct: "The overreliance on ROAS as the benchmark of value is over. Independent, transparent measurement is the baseline."
The Hidden Costs ROAS Ignores
- Platform fees and data access costs beyond base ad spend
- Contribution margin after all fulfillment and logistics costs
- The difference between defensive spend (maintaining position) and offensive investment (driving growth)
- Sales that would have occurred organically without advertising
- Customer lifetime value beyond the attribution window
The Attribution Fragmentation Problem
Each retail media network uses different attribution windows, different last-touch models, and different ways of assigning credit. This fragmentation makes it impossible to build a unified view of performance.
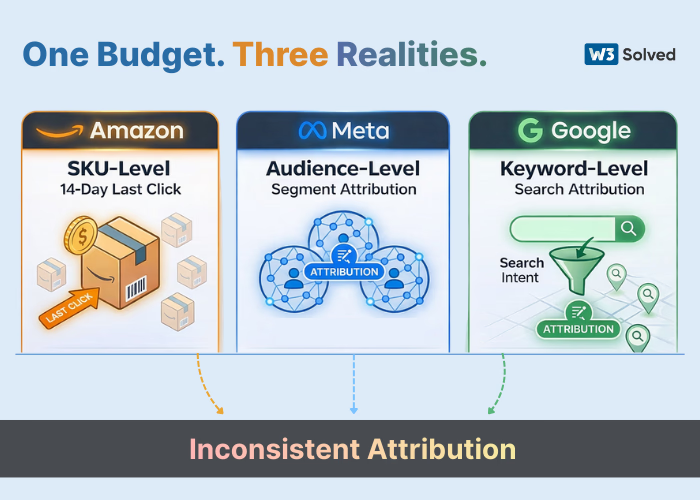
Amazon measures at SKU level. Meta measures by audience segment. Google measures by keyword. According to Northwestern University's Medill research on retail media measurement, this creates conflicting internal views that erode confidence in results.
Platform-Specific Attribution Methodologies
Amazon primarily uses last-click attribution within a 14-day window for sponsored products. If a customer clicks your sponsored product ad and purchases within 14 days, Amazon attributes the full sale to that ad.
Walmart Connect uses a combination of view-through and click-through attribution with different windows depending on ad format. Display ads get longer view-through windows than search ads.
Target Roundel uses its own proprietary attribution that weighs in-store purchases differently from online purchases, attempting to capture the omnichannel customer journey but making direct comparison with online-only networks difficult.
According to EMARKETER research, some retailers have standardized attribution rules internally. Albertsons Media Collective, for example, only counts conversions that occur after ad exposure. "If you saw it on the 14th and bought it on the 13th, we don't get credit," explained Evan Hovorka, VP of Product and Innovation at Albertsons.
But these standards apply only within each network. Comparing Albertsons' standardized attribution with Amazon's methodology still requires translation and normalization that most brands aren't equipped to handle.
The Data Access Problem
Most retail media networks operate as black boxes. They provide aggregated reporting but don't allow brands to export the underlying impression, click, and conversion data needed to build unified attribution models.
According to Ciente's analysis, underneath the measurement fragmentation is a data architecture problem. RMNs are closed systems. Their first-party data doesn't flow out cleanly, and their reporting doesn't integrate natively with brands' own data infrastructure.
This makes it nearly impossible to run true multi-touch attribution across networks without expensive third-party platforms specifically designed to aggregate and normalize retail media data. For businesses exploring how to properly track digital marketing performance across channels, our guide on essential digital marketing tools covers the infrastructure needed for accurate cross-channel measurement.
Signs Your Attribution Is Broken
- You can't compare cost-per-acquisition across retail media networks
- Your total attributed revenue exceeds your actual revenue
- You rely on each platform's dashboard without cross-network validation
- Your CFO questions retail media ROI and you can't defend it with data
- Budget allocation decisions are based on spend history, not performance analysis
How Incrementality Fixes This?
Incrementality measurement answers the only question that actually matters: what additional sales happened because of advertising that would not have occurred otherwise?
Unlike ROAS, which attributes all revenue within a conversion window to the ad, incrementality isolates the true causal impact of advertising through controlled testing. According to CommerceIQ research, this distinction is what separates brands that optimize retail media spend from those that simply increase it.
How Incrementality Testing Works?
The matched market methodology is the standard approach for retail media incrementality. Test stores running in-store campaigns are compared against carefully matched control stores with no media exposure. The performance difference between the two groups represents incremental lift attributable solely to advertising.
According to recent reporting from invidis, Albertsons Media Collective now uses nearly 60 variables for advanced store-level matching to reduce bias and statistical noise. This allows them to estimate what would have happened without media exposure, producing causal measurement of incremental sales rather than just attribution credit.
For digital campaigns, the approach is similar but uses audience-level holdouts. A percentage of your target audience doesn't see your ads. After the campaign, you compare purchase behavior between the exposed group and the holdout group. The difference is your incremental lift.
Incremental ROAS vs. Standard ROAS
Incremental ROAS (iROAS) divides incremental revenue, the portion that wouldn't have occurred without advertising, by ad spend. This gives you a consistent KPI for measuring performance across different retail media networks.
Here's why it matters. According to research from Northwestern University and Dentsu on retail media measurement, platform-reported ROAS doesn't reflect what CFOs care about: contribution margin after all fees, incrementality versus baseline sales, and the distinction between defensive spend and offensive investment.
Building unified measurement infrastructure that normalizes performance across Amazon, Walmart, Instacart, and other networks using consistent methodology gives you the ability to compare cost-per-incremental-sale across all platforms.
The Leadership Gap in Incrementality Measurement
According to Stratably's 2026 State of Retail Media report, only 21% of leading brands rate themselves as "good at measuring" incrementality, and just 20% feel genuinely confident in their incrementality measurement capabilities.
But the gap between leaders and laggards is significant. Only 7% of leaders don't measure incrementality at all, compared to 21% of laggards. Leaders are further along the journey, typically starting with one ad format on their largest network and expanding from there.
The practical takeaway: don't try to solve for incrementality across all networks simultaneously. Start with your largest investment, establish measurement discipline there, then expand progressively. Just as businesses need to adapt their strategies when facing new competition, retail media measurement requires evolution from basic ROAS to sophisticated incrementality analysis.
What Incrementality Actually Measures?
- New customers acquired who wouldn't have purchased otherwise
- Existing customers who increased basket size due to ad exposure
- Purchase acceleration (buying sooner than they would have)
- True lift over baseline organic sales trends
- The causal impact of advertising, not just correlation
Building Cross-Network Measurement That Works
Fixing retail media attribution requires infrastructure, not just better dashboards. Most brands need to build unified measurement systems that normalize performance data across all active networks.
Step 1: Establish Baseline Metrics
Before you can measure incrementality, you need accurate baseline sales data by product, region, and customer segment. This means pulling clean transaction data from each retailer and establishing what your organic sales trajectory looks like without paid media.
For most brands, this requires integrating retailer point-of-sale data, loyalty program data, and online transaction data into a unified data warehouse. According to eMarketer's 2026 Commerce Media predictions, 86% of commerce media decision-makers say strengthening measurement and attribution is a high or critical priority.
Step 2: Standardize Attribution Windows
Choose a consistent attribution window for comparison across networks even if individual platforms use different native windows. A 14-day click-through window and 7-day view-through window provides reasonable balance for most retail categories.
Apply this standard when analyzing data pulled from each network, not when running the campaigns. Campaigns still run using each platform's native attribution, but your internal analysis uses normalized windows for fair comparison.
Step 3: Implement Holdout Testing
Start with your largest retail media investment. Establish a 5-10% audience holdout that doesn't see your ads. Run this for 60-90 days to build statistically significant data.
Compare purchase behavior, basket size, and conversion rate between exposed and holdout groups. The difference, adjusted for baseline trends, is your incremental lift. Calculate iROAS by dividing incremental revenue by ad spend for that network.
According to AdExchanger analysis, longitudinal measurement that tracks how groups of shoppers move through the purchase path over time provides far more reliable insights than single-touchpoint attribution.
Step 4: Build Cross-Network Comparison Framework
Once you have incremental performance data from each major network, you can build meaningful comparison. Calculate cost-per-incremental-sale, incremental customer acquisition cost, and true contribution margin after all platform fees for each network.
This gives you the data to answer questions like: Which networks drive new customer acquisition versus repeat purchases? Which networks deliver the highest incremental margin after fees? Where is our defensive spend protecting market share versus offensive spend driving growth?
For brands managing complex digital ecosystems, comprehensive PPC management and conversion optimization work hand-in-hand with retail media measurement to maximize total marketing ROI. Just as brands need to adapt when facing new competition, retail media requires unified data infrastructure across all networks.
Step 5: Establish Decision Cadence
Measurement without action is wasted effort. Establish a monthly review process where cross-network performance data informs budget reallocation decisions.
According to Northwestern University research, the biggest barrier to incrementality measurement isn't data access or methodology, it's lack of analytics capability, clear ownership, and cross-functional alignment. Without these operational foundations, insights fail to drive decisions.
Assign clear ownership. Typically this means a dedicated retail media manager who works across e-commerce, performance marketing, and finance teams to maintain consistent measurement standards and translate insights into budget decisions.
Your 90-Day Implementation Plan
- Week 1-2: Audit current retail media spend across all networks and document attribution methodologies each platform uses
- Week 3-4: Establish baseline sales data by retailer, product line, and region for the past 12 months
- Week 5-6: Define standardized attribution windows and incrementality testing approach for largest network
- Week 7-8: Implement holdout groups on largest retail media network (5-10% of audience)
- Week 9-12: Build data infrastructure to pull and normalize performance data across all active networks
- Month 2: Run first 60-day incrementality test on largest network; begin second network implementation
- Month 3: Calculate iROAS for tested networks; establish cross-network comparison framework; present findings to finance and e-commerce leadership
What This Means for Your Business?
Retail media isn't slowing down. US spending will reach $71.09 billion in 2026, growing 17.8% year-over-year. But brands that continue making budget decisions based on platform-reported ROAS alone are operating blind.
The measurement gap between leaders and laggards is widening. Leaders allocate 27% of media budgets to retail media versus 23% for laggards, a four percentage point difference that represents 1-2 years of competitive advantage. They also activate across more networks (7.2 versus 6.2), measure incrementality more consistently, and have clearer internal alignment on performance standards.
You don't need perfect measurement to start making better decisions. Begin with your largest retail media investment, establish incrementality discipline there, then expand progressively. The goal isn't immediate precision, it's building repeatable measurement operating models that turn retail media from a reporting exercise into a growth driver.
According to industry analysis from AdExchanger, retail media's next phase depends on full-funnel measurement that reflects actual shopping behavior rather than single-touchpoint attribution. The future belongs to brands that measure what truly matters and hold themselves accountable for incremental business outcomes.
For businesses looking to build this measurement capability, working with a partner experienced in data-driven PPC management and e-commerce optimization can accelerate the transition from basic ROAS reporting to sophisticated incrementality analysis. The infrastructure you build for retail media measurement also strengthens your ability to evaluate performance across every digital channel. As AI continues reshaping consumer behavior, unified measurement becomes even more critical for understanding true campaign impact.
Frequently Asked Questions About Retail Media Measurement
Why is retail media ROAS misleading?
Retail media ROAS is misleading because each platform measures attribution differently, making cross-network comparison impossible. Amazon reports by SKU, Walmart by audience segment, and Target uses different attribution windows.
More critically, ROAS cannot tell you what percentage of sales would have occurred anyway without advertising, making it impossible to measure true incremental growth.
What's the difference between ROAS and incremental ROAS?
ROAS measures total revenue attributed to ads divided by ad spend. Incremental ROAS (iROAS) measures only the new revenue that wouldn't have happened without the ads.
For example, if your ROAS is 5:1 but only 40% of sales are truly incremental with a 30% margin, your real ROI is just 20%, not 500%.
How do I measure true incrementality in retail media?
Measure incrementality through matched market testing, where test stores running campaigns are compared against control stores with no ads. The difference in performance represents true incremental lift.
For digital campaigns, use audience-level holdouts where 5-10% of your target audience doesn't see ads. Compare purchase behavior between exposed and holdout groups after 60-90 days.
Start with your largest retail media investment, establish measurement there, then expand to other networks progressively.
Which retail media networks have the best measurement?
As of 2026, Albertsons Media Collective and Sam's Club Member Access Platform lead in measurement sophistication, offering AI-driven tools with 12-month multichannel views and standardized attribution rules.
Amazon and Walmart remain dominant but use proprietary measurement that's difficult to compare across platforms. Albertsons, for instance, only counts conversions after ad exposure and uses nearly 60 variables for store-level matching to reduce bias.
Should I stop using ROAS completely?
No. ROAS remains useful for real-time campaign monitoring and platform comparison. The benefit of ROAS is that it's easy to calculate and can be measured near real-time.
However, never use ROAS alone to evaluate retail media effectiveness or make budget allocation decisions. Always pair it with incrementality measurement to understand true business impact and justify continued investment.
How much should I budget for retail media in 2026?
Retail media leaders allocate 27% of total media budgets to retail media networks compared to 23% for underperformers. This four percentage point gap represents 1-2 years of competitive advantage.
US retail media spend is projected to reach $71.09 billion in 2026, growing 17.8% year-over-year. Start with your current digital budget and reallocate based on proven incremental performance, not just platform-reported ROAS.