Every SEO blog this year has a stat like this. 136% increase in AI visibility. 586% increase in generative AI traffic. 300% more citations in AI Overviews. The number is usually the headline. The methodology behind it is usually a footnote, if it gets mentioned at all.
None of this makes the number fake. A genuine improvement can absolutely produce a real percentage. The problem is that a percentage on its own tells you almost nothing, and the AI search world right now is full of figures built to look impressive rather than to be checked.
Here's how to read one of these case studies properly, what questions actually matter and what rigorous AI visibility research looks like when someone does it right.
What You Will Learn?
- Why Are AI Visibility Case Studies Suddenly Everywhere?
- What Baseline Is the Percentage Actually Measured Against?
- Is the Metric Tied to Revenue or Just to Visibility?
- What Tool Produced the Number and Can It Be Verified?
- How Long Was the Measurement Window?
- Does the Case Study Control for Anything Else That Changed?
- What Does Rigorous AI Visibility Research Actually Look Like?
- What Should You Ask an Agency Before Trusting Their Numbers?
- Frequently Asked Questions
Why Are AI Visibility Case Studies Suddenly Everywhere?
AI Overviews, AI Mode and answer engines like ChatGPT and Perplexity changed what an agency can sell. Rankings used to be the entire pitch. Now the pitch has shifted toward being cited inside an AI-generated answer, since so many queries resolve as zero-click searches before a user ever reaches a list of blue links.
That shift created a rush to publish proof. Every agency wants a number that shows it has already adapted, and the AI visibility space is young enough that almost nobody has a track record longer than a year or two. So the case studies lean hard on percentage lifts, since a percentage sounds definitive even when the underlying numbers are small.
Why This Matters Before You Hire Anyone
- The space is new: most reported AI visibility gains are measured over months, not years, so there's little long-term data to compare against.
- The tools are proprietary: most agencies use their own tracking platform, which means the number is only as trustworthy as a methodology you usually can't see.
- The incentive is one-sided: a case study exists to sell services, not to pass peer review, so it will always be framed in the most favorable light available.
What Baseline Is the Percentage Actually Measured Against?
This is the single most important question and the one most case studies skip. A percentage without a baseline is close to meaningless. If a page went from two AI citations a month to eight, that's a real 300% increase and also a genuinely small amount of visibility. If it went from 200 citations to 800, that's the same percentage describing a completely different outcome.
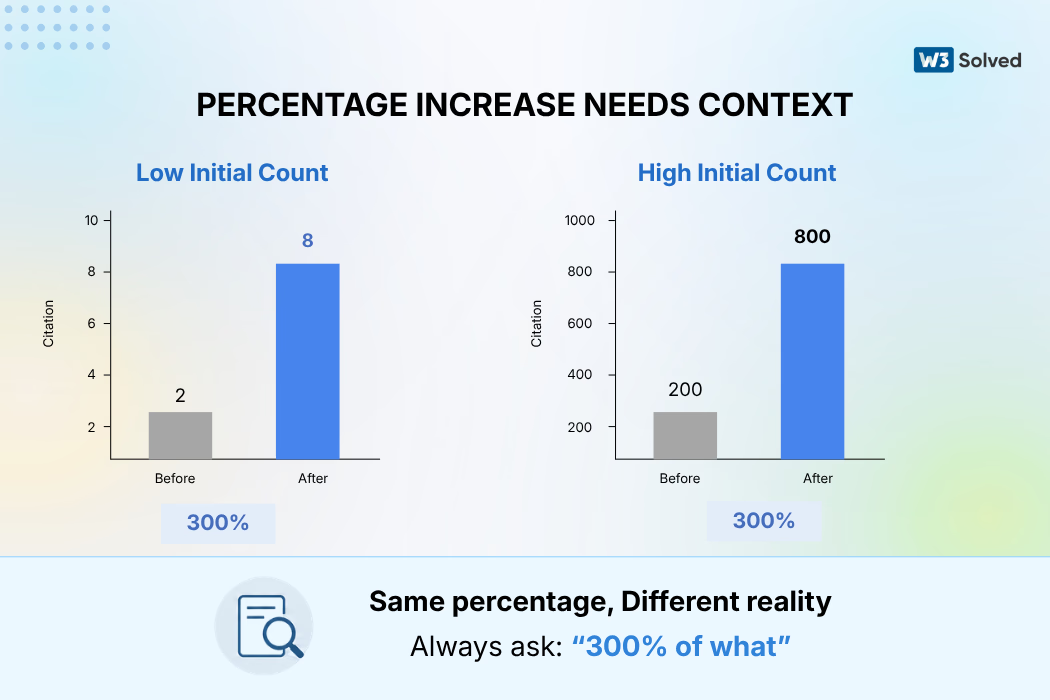
What to look for: the actual before-and-after numbers, not just the percentage change. As the Content Marketing Institute has pointed out, a metric presented in isolation is almost always misleading, since the number alone can't tell you whether the underlying activity was meaningful or trivial. If a case study won't show you the raw figures behind the percentage, treat that omission as the answer.
Is the Metric Tied to Revenue or Just to Visibility?
AI visibility benchmarks now include things like AI citations, AI mentions, visibility rate and content inclusion rate. These are useful directional signals. They are not, by themselves, business outcomes. A page can be cited constantly in AI answers and generate zero incremental leads if the query intent never matched a buying decision.
This is the same trap marketers have been falling into for years with social followers and page views. A number that looks impressive but doesn't connect to a business result is a vanity metric, and HubSpot's own research makes the same point: a high number on its own rarely tells you whether visitors, or in this case citations, actually moved toward a purchase decision. Before you get excited about a visibility percentage, ask what happened to leads, demo requests or revenue in the same window.
A pattern worth watching for: case studies that report visibility metrics prominently and revenue metrics vaguely, or not at all. If a report leads with "AI visibility increased 136%" and buries "leads increased" somewhere in a single sentence with no number attached, that gap is usually not an accident.
What Tool Produced the Number and Can It Be Verified?
Most AI visibility tracking right now runs on proprietary platforms built by the agency selling the service. That's not automatically a problem. It does mean the number can't be checked against an outside standard the way a Google Search Console figure or a Google Analytics session count can.
Ask which tool produced the figure, whether the methodology has been published anywhere and whether the same result would show up if you ran the query yourself through the AI platform in question. If the answer to that last question is a shrug, the number is describing something internal to the vendor's dashboard rather than something you or a third party could independently confirm.
How Long Was the Measurement Window?
A 90-day window and a 12-month window tell very different stories, and case studies rarely specify which one produced the headline number. Short windows are also more vulnerable to seasonal spikes, a single viral mention or a temporary change in how an AI platform is sourcing answers that has nothing to do with the work being credited.
Request the month-by-month trend line, not just the start and end points. A steady climb across a year tells a very different story than a single good month that happened to land right before the case study was published.
Does the Case Study Control for Anything Else That Changed?
AI visibility gains rarely happen in a vacuum. A site migration, a new backlink campaign, a broader algorithm update at Google or a shift in how a particular AI platform sources citations can all move the number at the same time as whatever tactic the case study is crediting. Correlation gets treated as causation constantly in this space, partly because untangling the actual cause requires more transparency than most agencies are willing to provide.
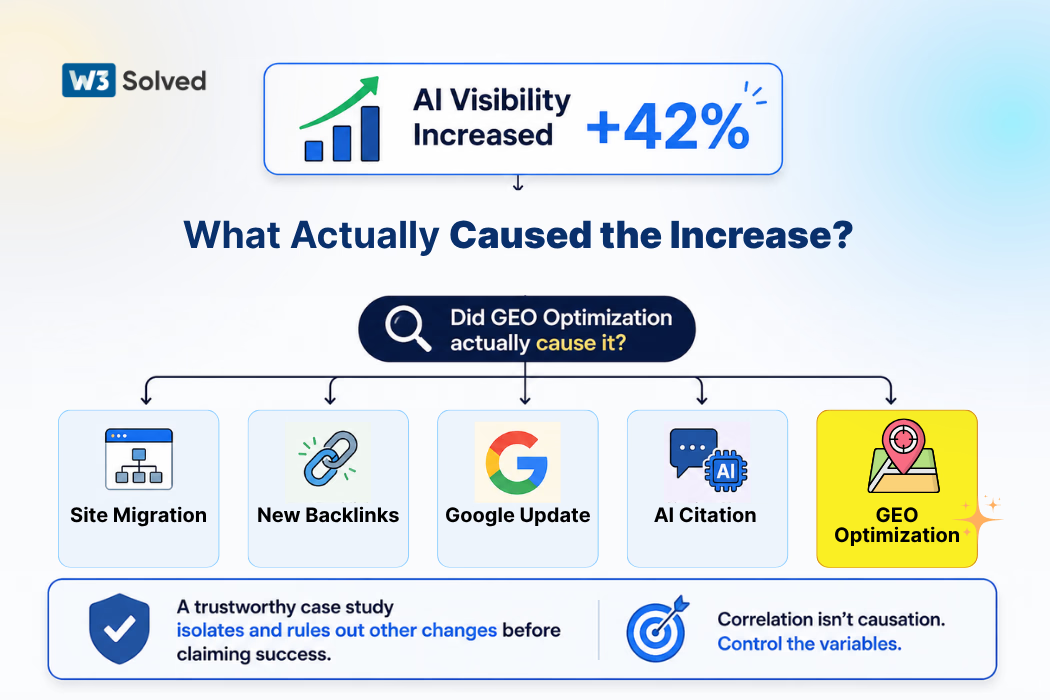
A rigorous case study names the other variables and explains why they were ruled out. A promotional one names only the variable it wants credit for.
What Does Rigorous AI Visibility Research Actually Look Like?
It's worth seeing the real version of this work, since it makes the gap obvious. Researchers studying generative engine optimization have published controlled experiments that define a fixed baseline, apply one content change at a time across thousands of queries and report the exact percentage improvement each individual technique produced, down to which methods actually worked and which ones didn't.
That study found that some tactics agencies commonly recommend, like keyword stuffing, produced little to no measurable improvement in AI citation rates, while specific techniques such as adding statistics and citations produced consistent, measurable gains. The point isn't that every case study needs to be a peer-reviewed paper. It's that a claim becomes far more credible once you can see the baseline, the sample size and the exact variable being tested, which is precisely the information most marketing case studies leave out.
The standard worth holding vendors to: a claim you could, in principle, verify or reproduce with the information given. If a case study gives you enough detail to at least sanity check the number, that's a meaningfully different category from a bare percentage in a headline.
What Should You Ask an Agency Before Trusting Their Numbers?
Whether you're evaluating a case study from a large national firm or a smaller organic SEO company, the same short list of questions applies. It works whether you're a direct-to-consumer brand or a B2B SEO agency client evaluating a longer sales cycle.
Questions Worth Asking Before You Believe the Percentage
- What were the actual before-and-after numbers, not just the percentage change?
- What tool produced this figure, and is the methodology published anywhere?
- What was the measurement window, and can I see the month-by-month trend rather than two endpoints?
- What else changed on the site or in the market during that same window?
- Does this metric tie to leads or revenue, or does it only measure visibility?
- Would a client in my exact situation, same industry and same starting point, see a similar result?
None of this means AI visibility work is snake oil, or that every agency reporting a big number is exaggerating. Plenty of the underlying work is genuinely good. The point is simpler than that: a percentage by itself is a claim, not evidence, and asking for the numbers behind it costs you nothing and tells you almost everything about whether the result is real.
Frequently Asked Questions
Why do so many AI visibility case studies show huge percentage increases?
Mostly because the baseline is often tiny. AI Overviews, AI Mode and answer engines are new enough that most sites started from near zero citations, so even a small absolute gain produces a large percentage.
A page moving from two citations a month to eight is a real 300 percent increase and also a very small amount of actual visibility.
What questions should I ask before trusting an AI visibility case study?
Ask what the absolute numbers were before and after, not just the percentage. Ask what tool produced the figure and whether it can be independently verified.
Ask how long the measurement window was and whether anything else changed during that period, such as a site migration, a separate campaign or a broader algorithm update. Ask whether the metric ties to a business outcome like leads or revenue, or whether it only measures visibility.
Is a metric like AI visibility rate a reliable way to judge SEO performance?
It can be a useful directional signal, but on its own it's closer to a vanity metric than a business metric. Visibility in AI answers doesn't automatically translate into traffic, leads or revenue, and the tools that measure it vary widely in methodology.
Treat it as one input alongside metrics tied directly to business outcomes rather than as proof of impact by itself.
What does rigorous AI visibility research actually look like?
It defines a clear baseline before any change is made, tests one variable at a time across a large and controlled sample, publishes the methodology in enough detail that someone else could repeat it and reports the actual numbers behind any percentage rather than the percentage alone.
Academic research on generative engine optimization, including controlled studies that test specific content changes across thousands of queries, is a useful benchmark for what a credible claim looks like.
Want a Second Opinion on Someone Else's Numbers?
If an agency has handed you a case study and you want a straight read on whether the percentage means what it sounds like, send it over. We'll walk through it with you, no pitch attached.
Get a Free SEO Assessment